Patentir Analytics
See where the pressure on your brand comes from
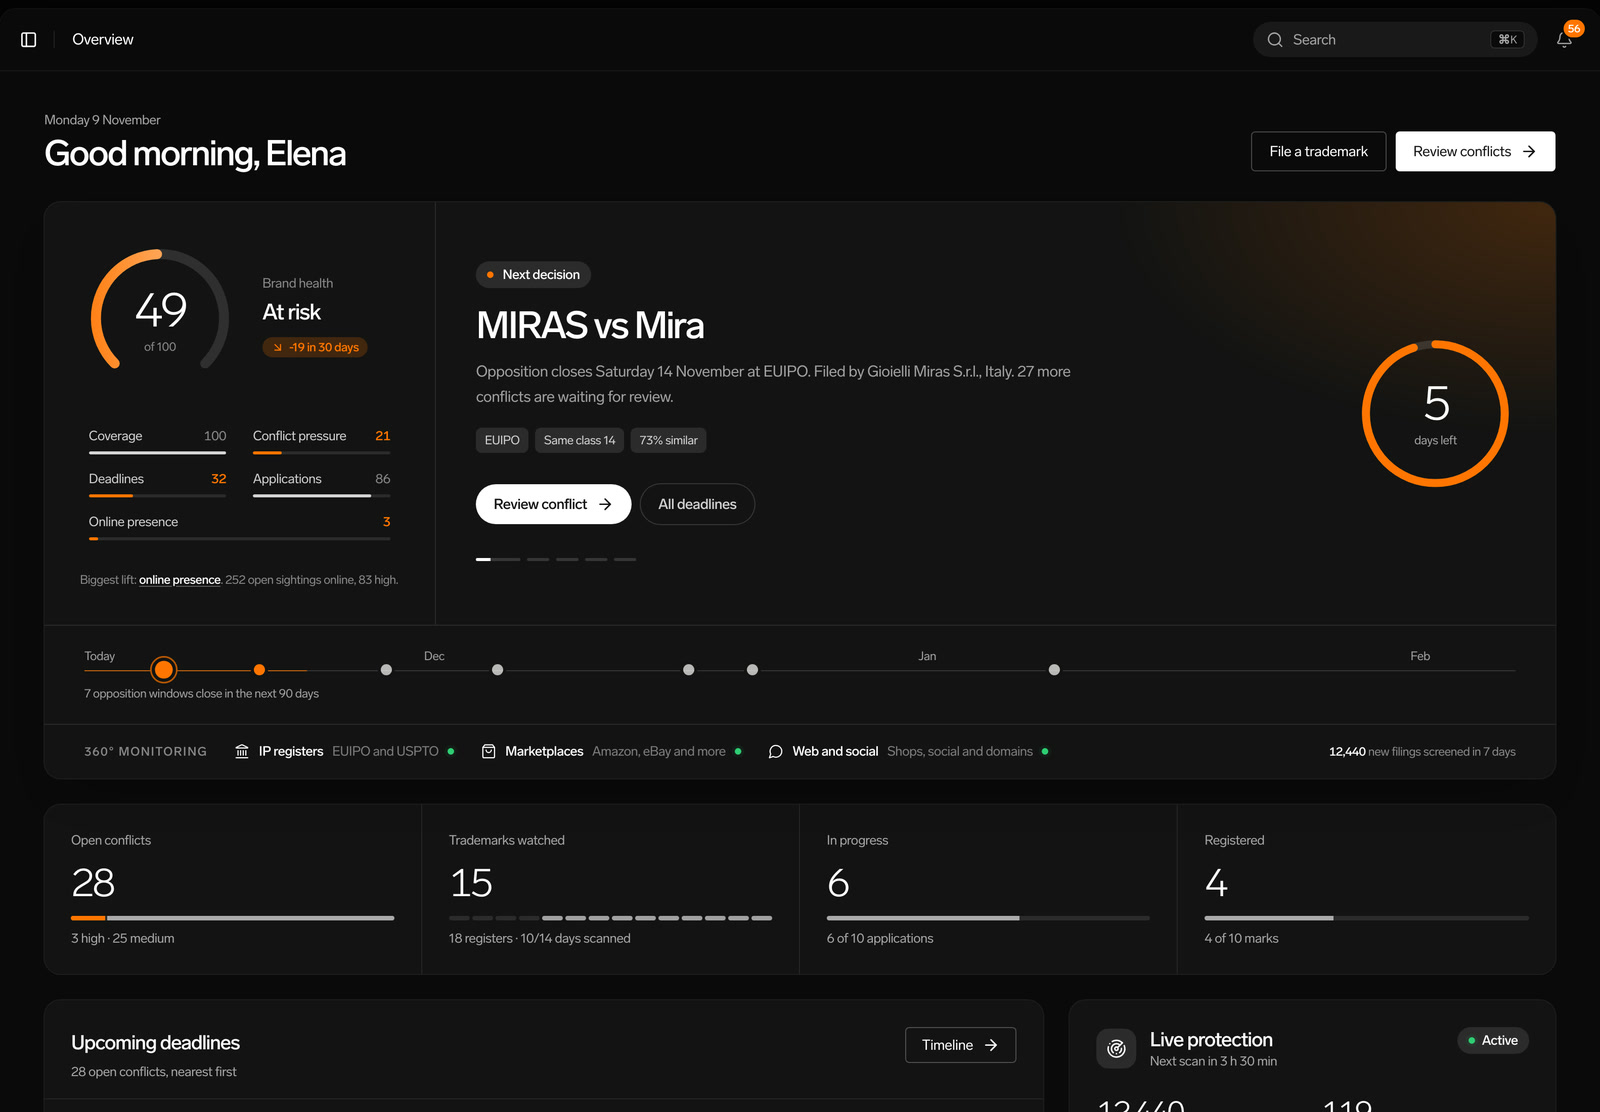
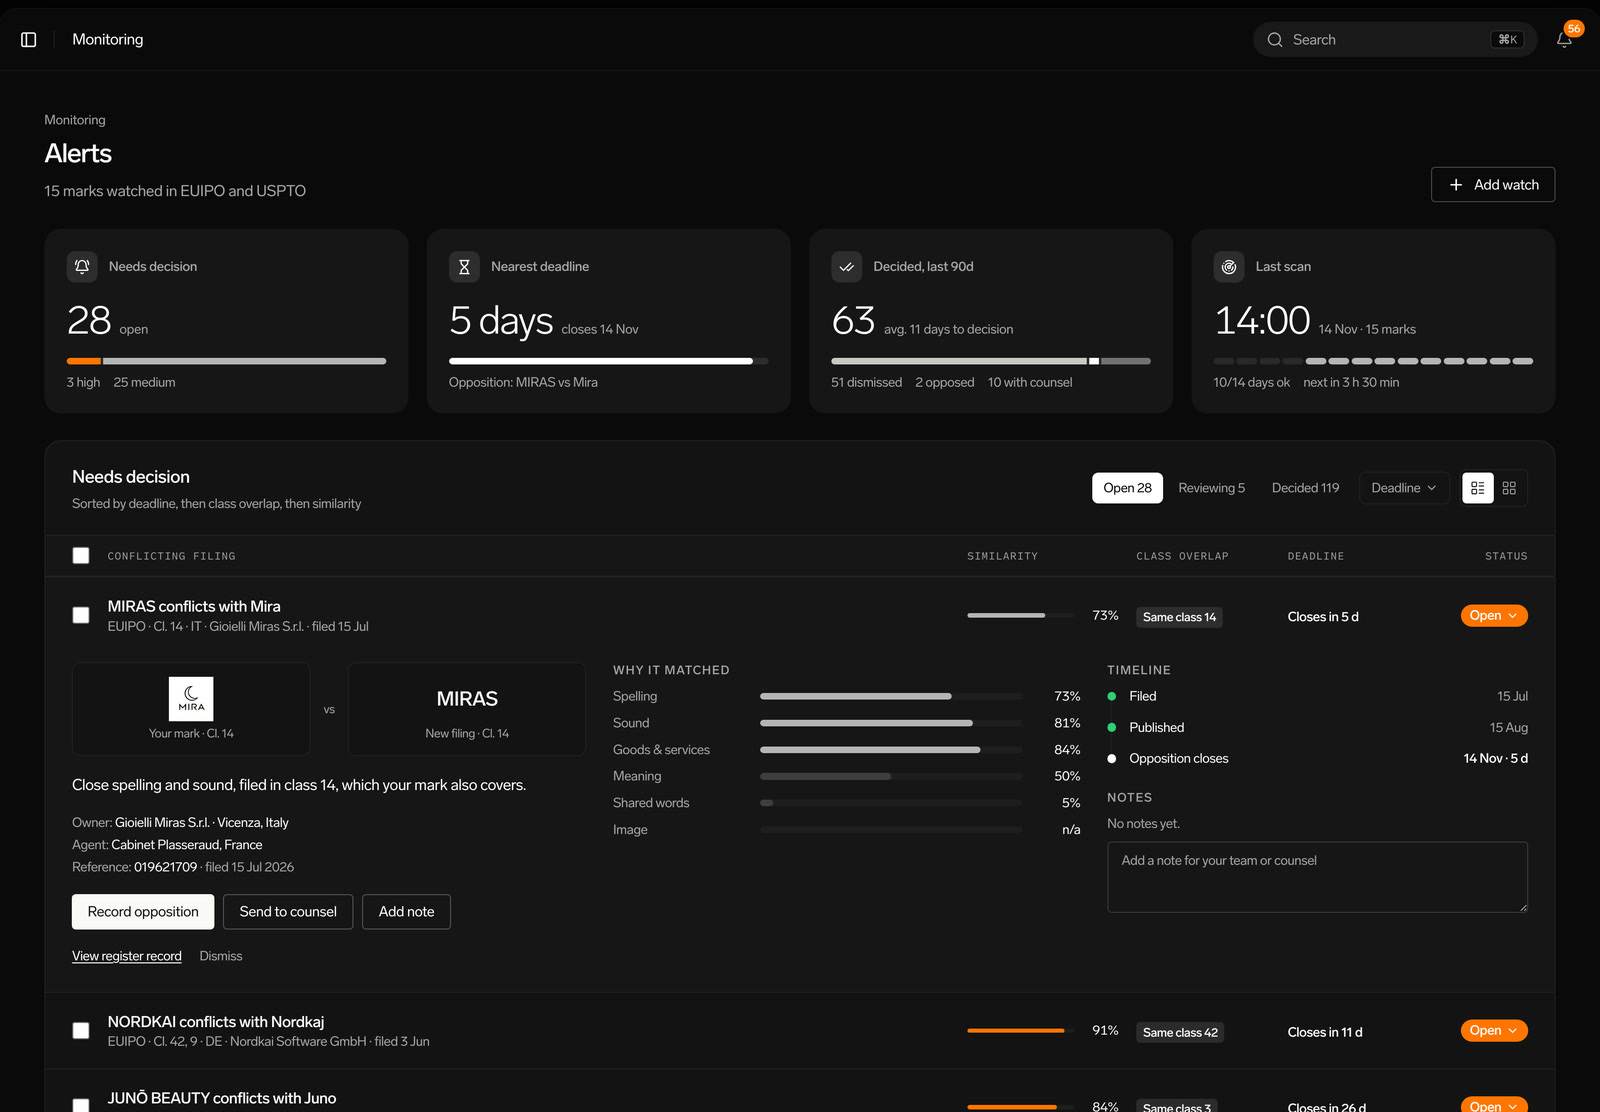
Analytics turns every alert and decision into a clear picture: how many filings come close, which marks and classes are under pressure, who keeps filing near you and how fast your team decides.
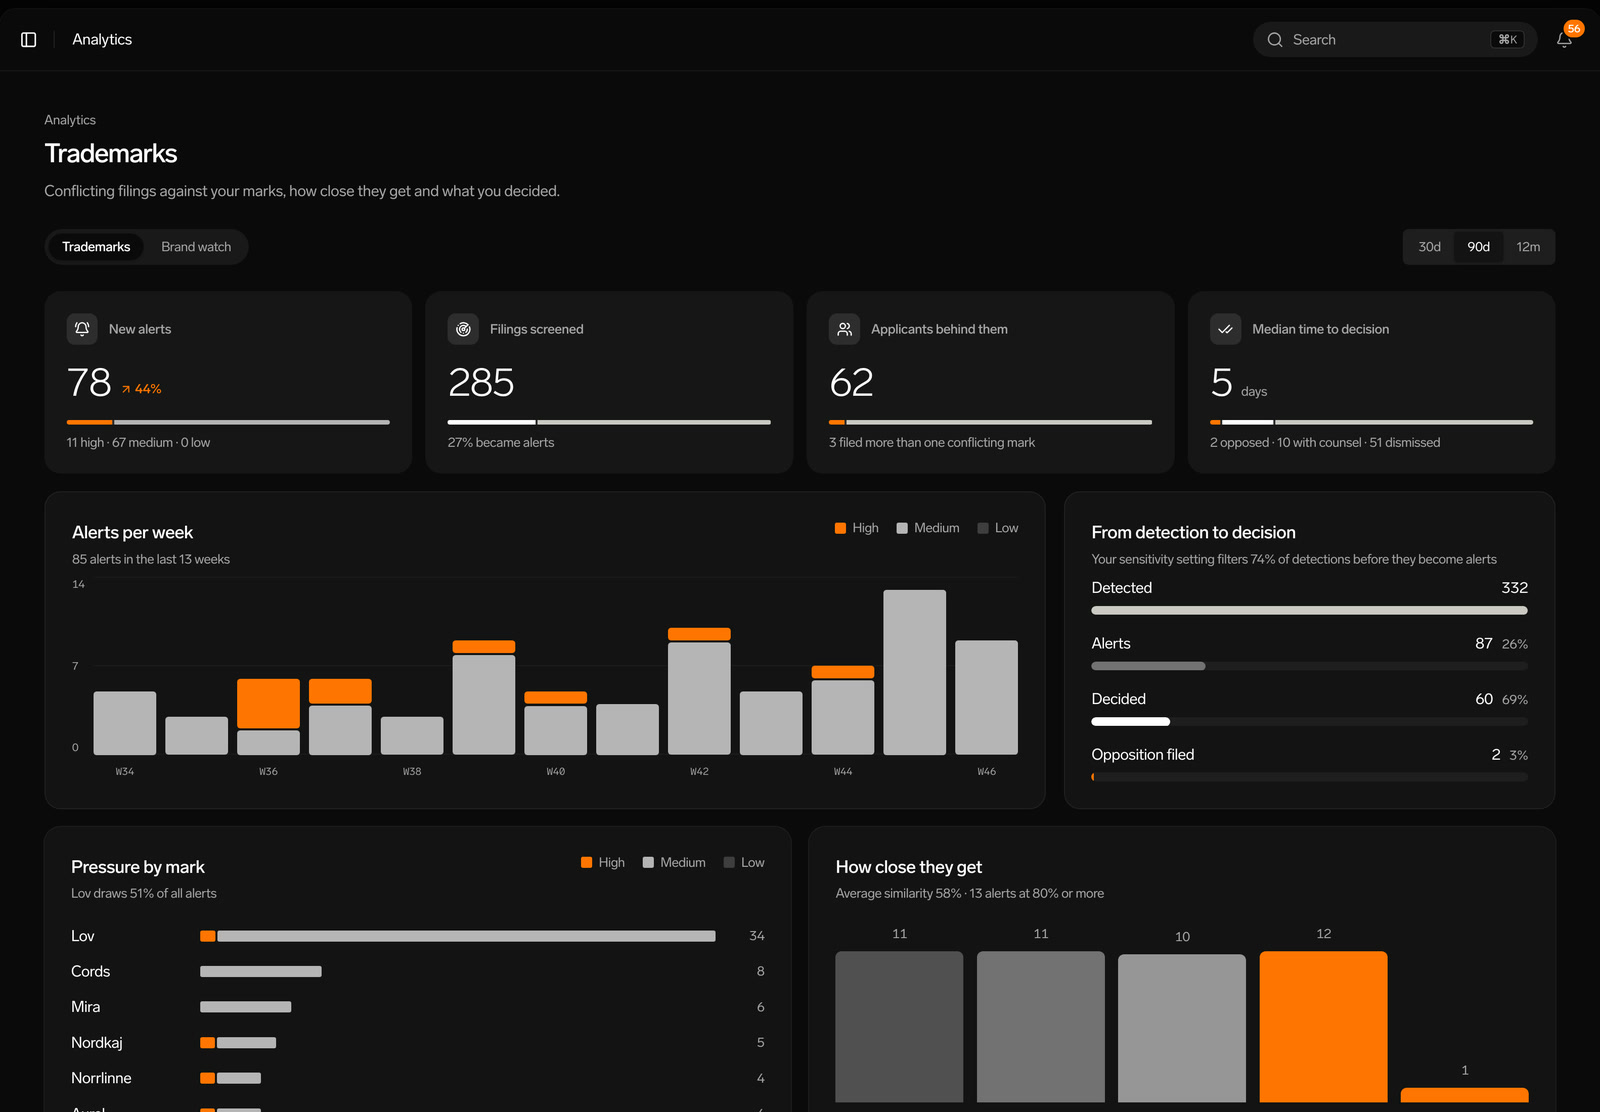
Key numbers
What matters, for any period
New alerts, filings screened, applicants behind them and median time to decision, for the last 30 days, 90 days or 12 months.
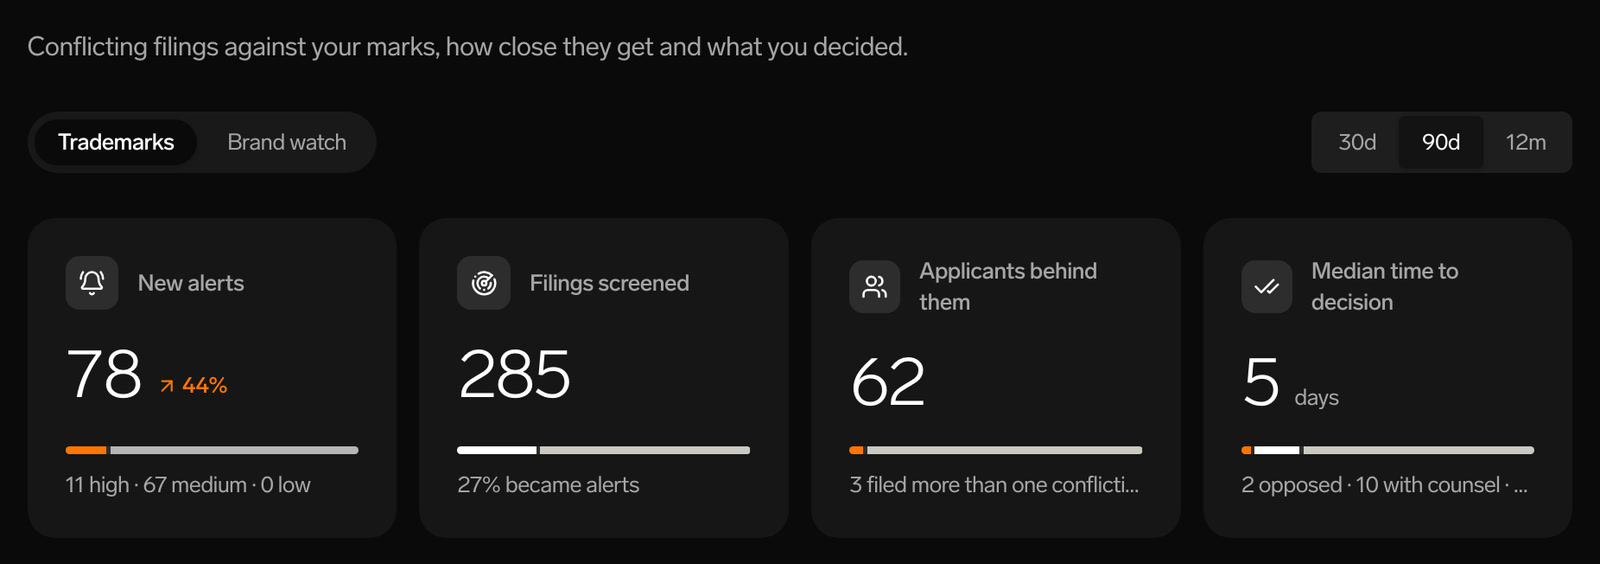
Trend
Alerts week by week
See how alerts develop over time, split by risk, so you notice when the pressure on your brand starts to grow.
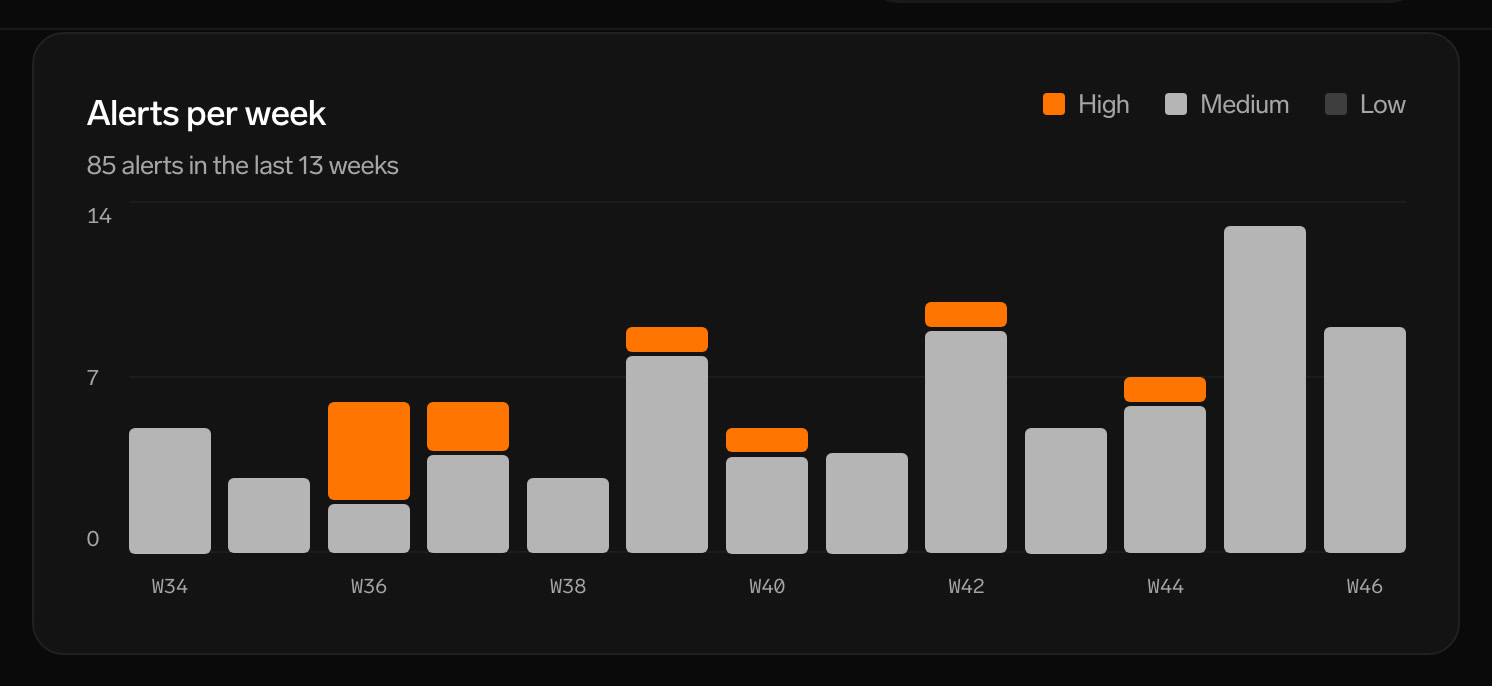
From detection to decision
See what your sensitivity filters out
Follow matches from detection to alert, decision and opposition, and see how much your sensitivity setting filters out before anything reaches you.
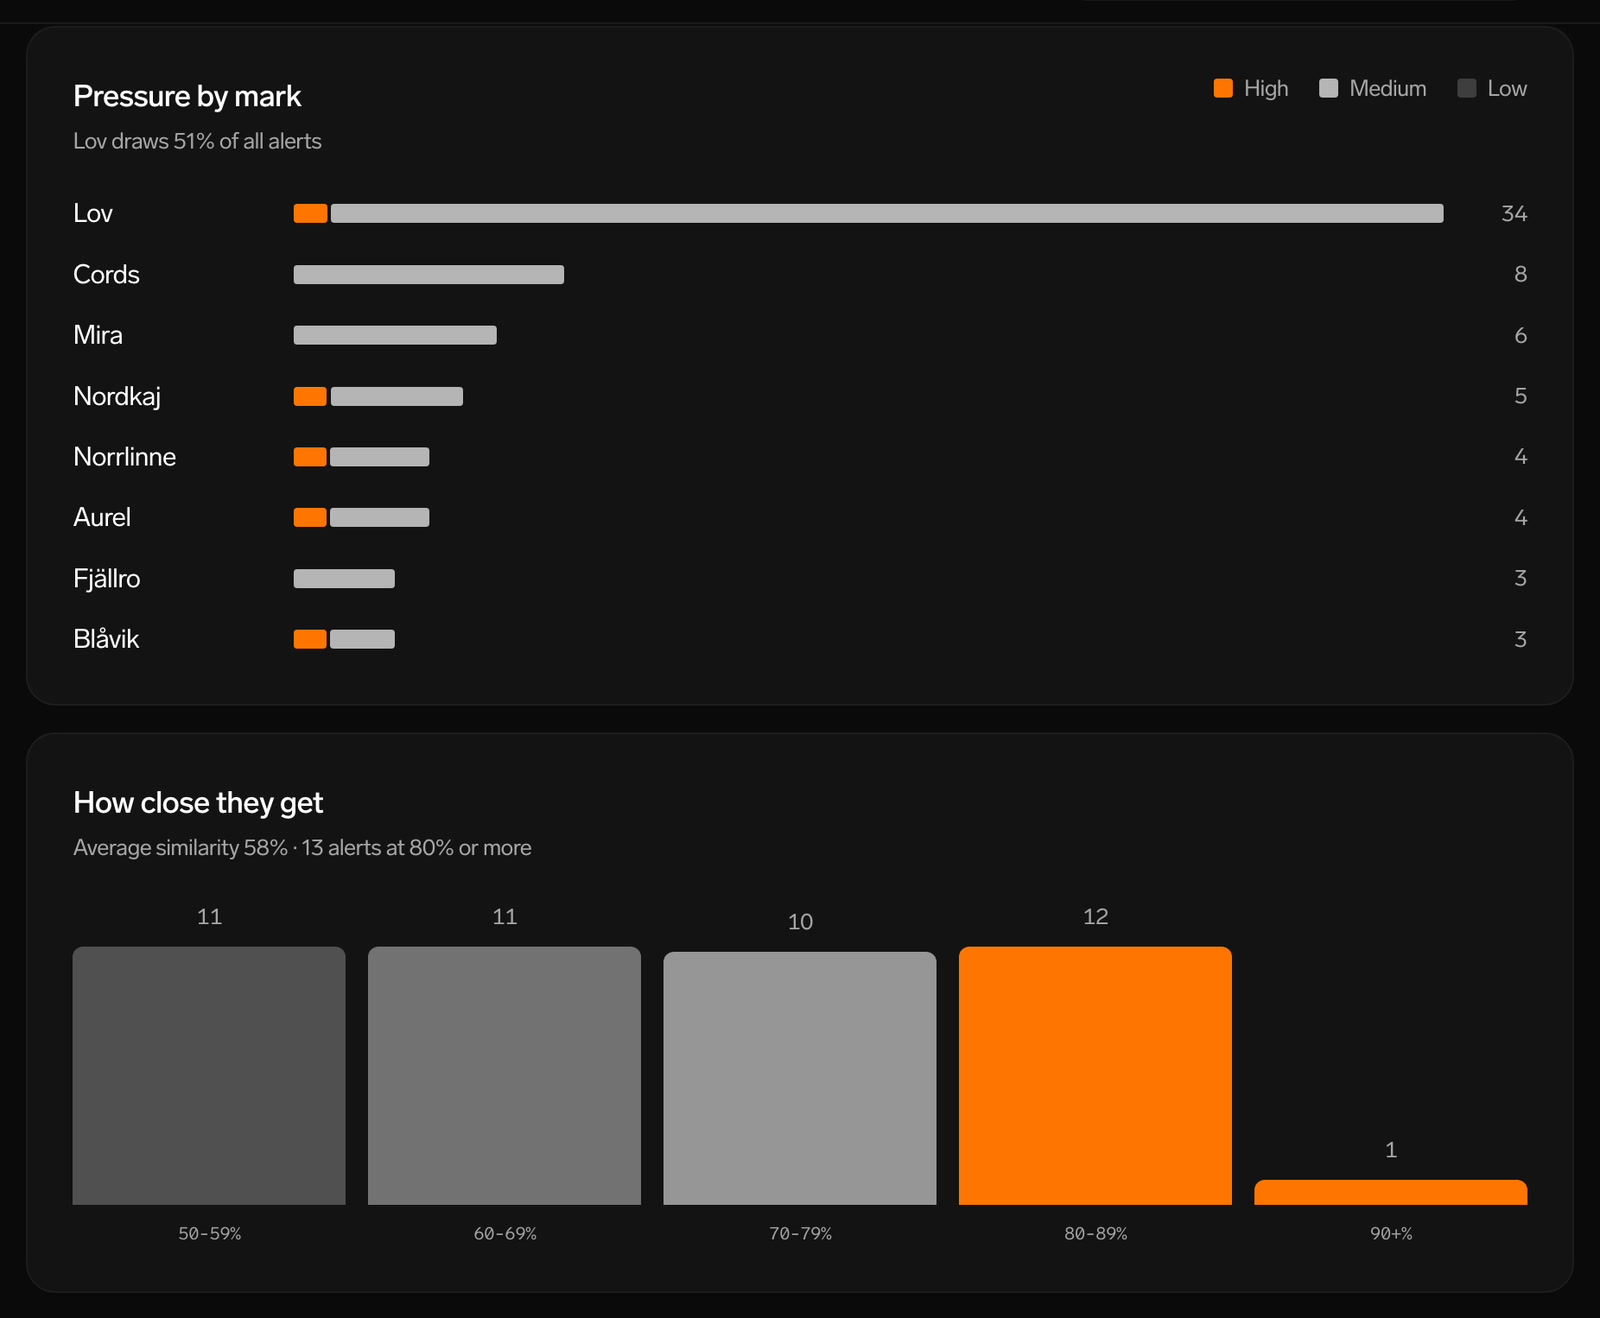
Pressure by mark
Find the marks and applicants to watch
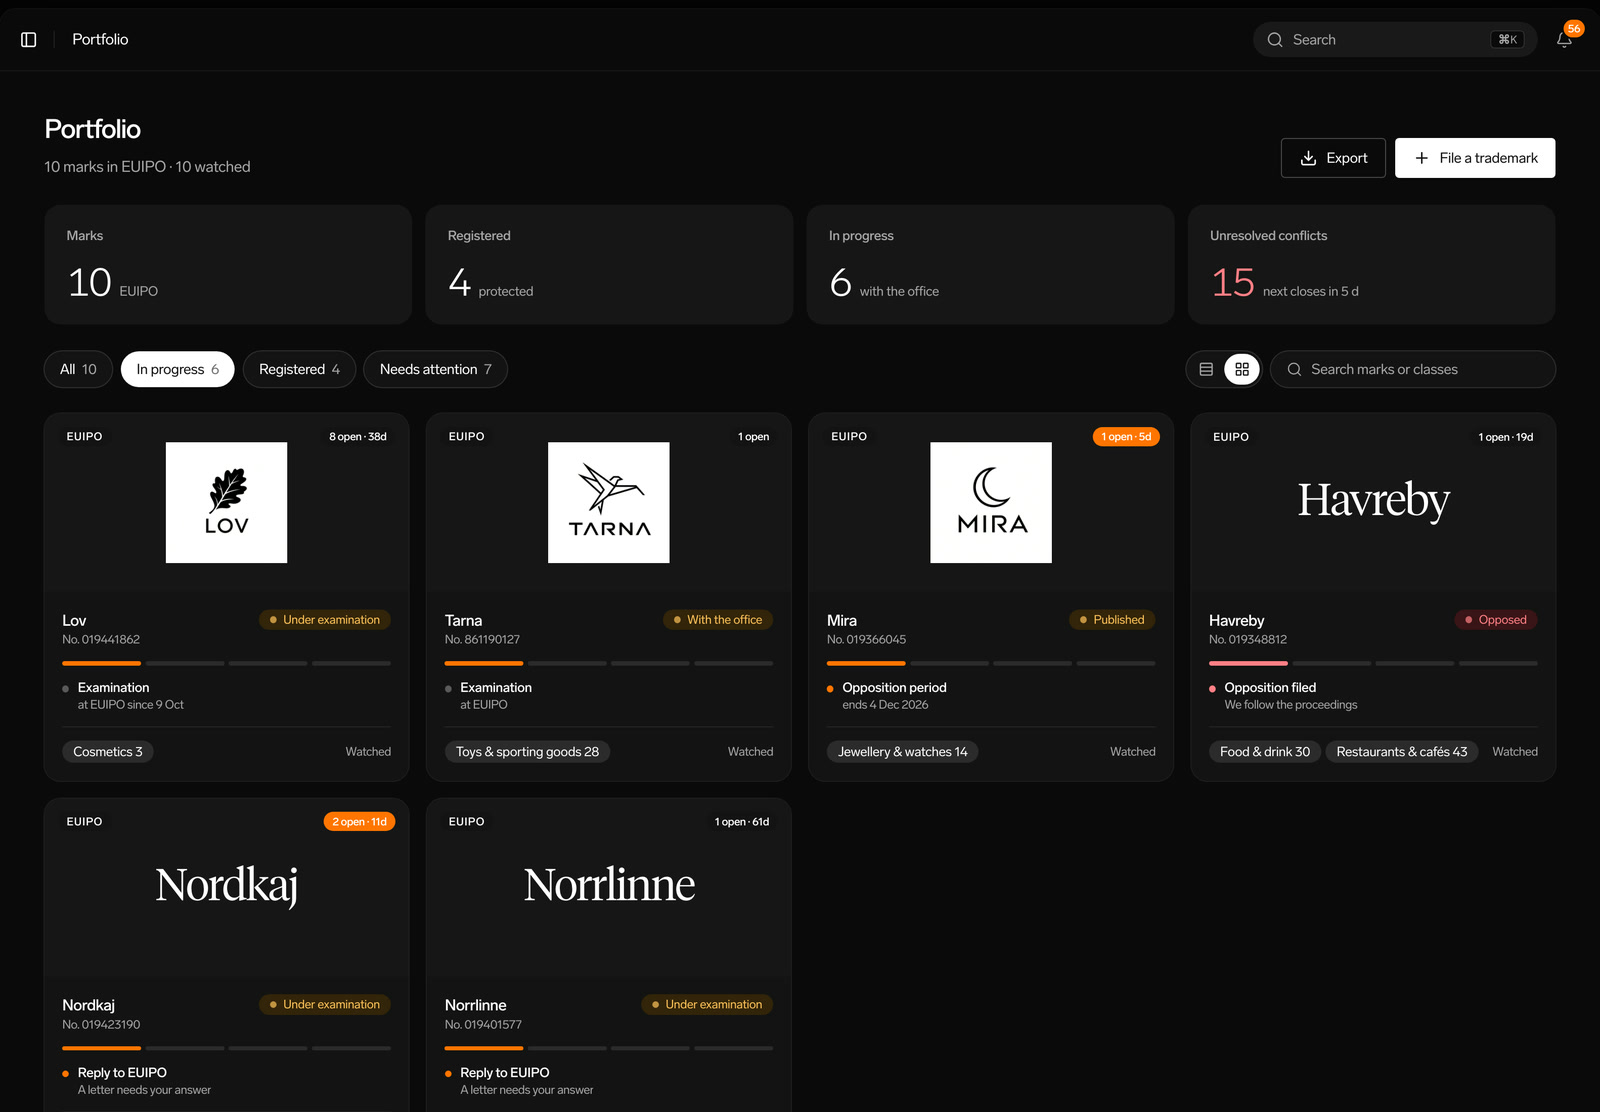
See which of your marks draw the most alerts, how close the filings get and which applicants file more than one conflicting mark.
Built for the people who use it every day
Registers and online in one place
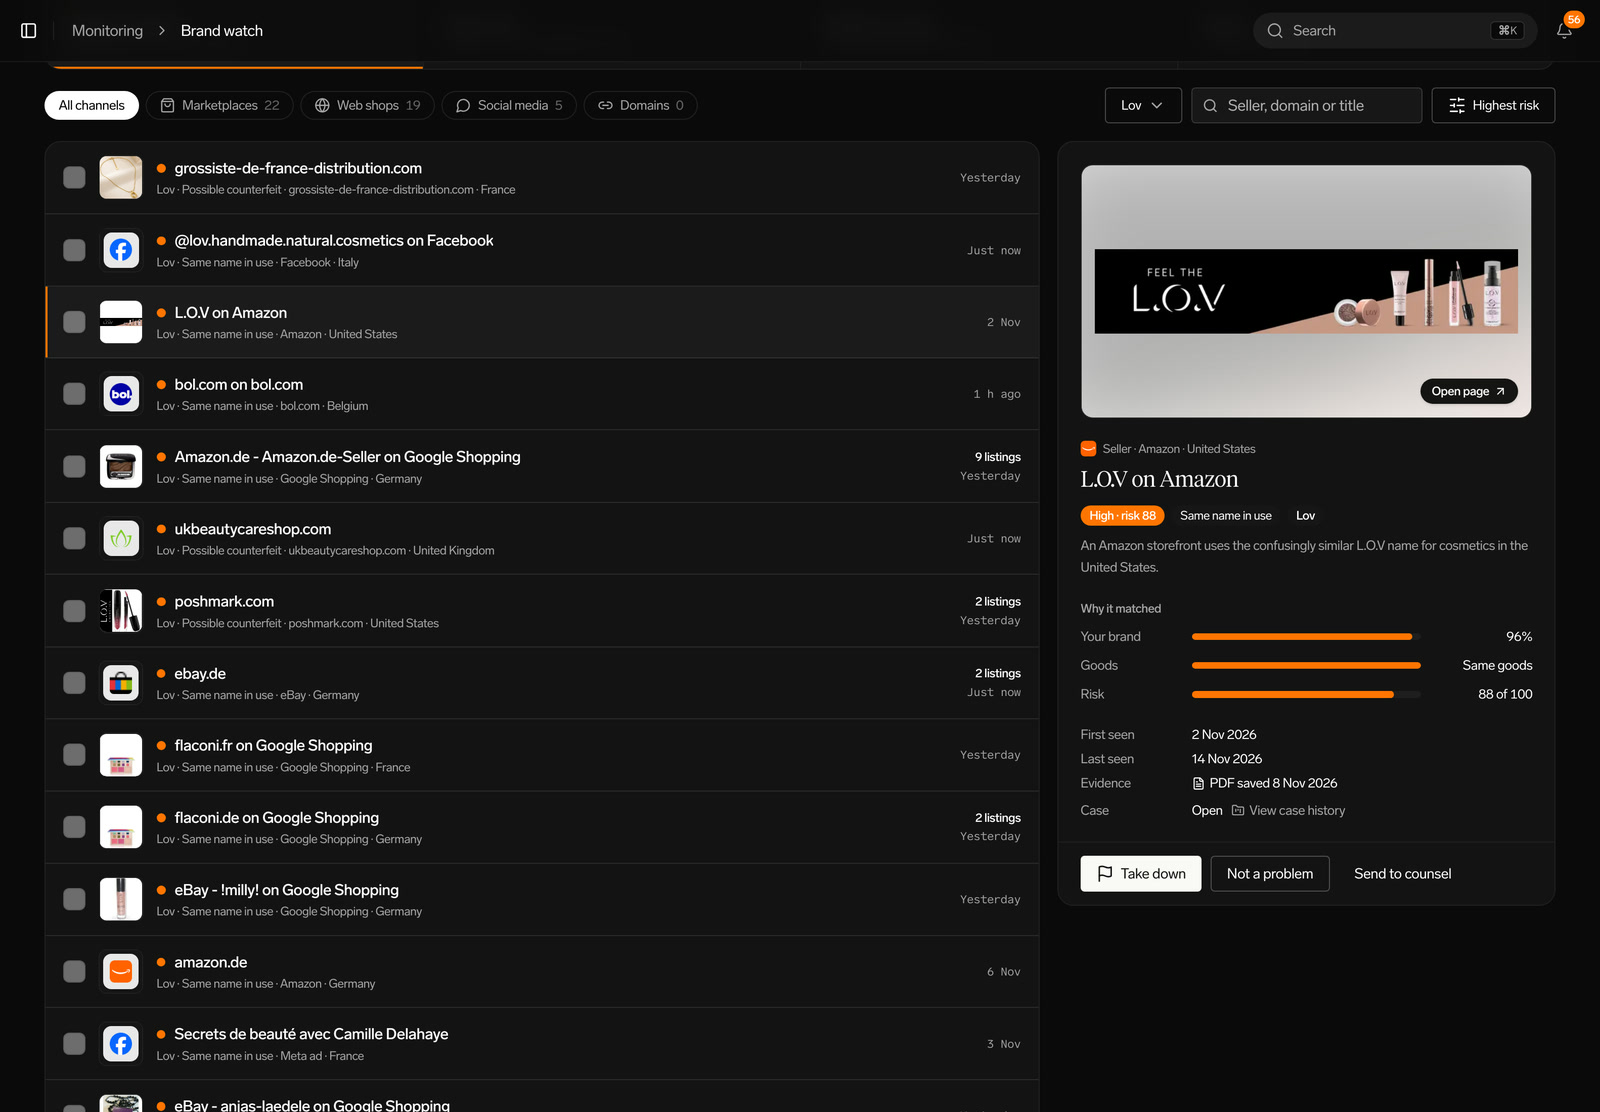
Switch to brand watch analytics for sightings, takedowns, removals and success rate.
Learn from your decisions
Outcomes show how many alerts were opposed, sent to counsel or dismissed.
Ready for management
Save a PDF report with brand health, what Patentir stopped and the open conflicts.
See it by class
Find the classes under pressure and the registers the conflicting filings come from.
Know where the next conflict will come from.
Get started - for freeMore of the platform
Questions and answers
Where does the data come from?
From the alerts Patentir finds among new EUIPO and USPTO filings for your watched marks, and from the decisions your team makes on them.
Can I see brand watch results too?
Yes. The brand watch tab shows sightings, takedowns sent, removals, success rate, median time to removal and results per channel.
Can I share the numbers?
Yes. Export your marks, conflicts and classes to Excel, or save a PDF report to share with management or a client.